Cross-platform advertising operations
2024 · Delivered client engagement
Brand Networks
Turning a spreadsheet workflow into an operable product
As a project management intern, I guided an eight-week client engagement that moved Brand Networks’ advertising-budget optimization workflow out of Google Sheets and into a configurable web application for execution, monitoring, and audit.

Quick scan
TL;DR
The shortest version: what changed, what shipped, what was verified, and where the proof stops.
Overview
Problem
Brand Networks’ optimization workflow depended on Google Sheets, text-heavy status updates, and a growing log that could accumulate hundreds of records in a day.
Move
Translated the spreadsheet’s operating model into three focused workflows: configure the algorithm, inspect campaign execution, and audit its actions.
Outcome
Delivered an integrated web application with configurable metrics and schedules, channel-filtered analytics, searchable logs, OAuth, and a containerized deployment path.
Scope
Project management across user research, requirements, prioritization, client alignment, design and engineering coordination, and eight-week delivery.
Proof
- Delivery window
- 8 weeksThe published project article dates the engagement from October through December 2024.
- Core workflow
- 3 product pagesConfiguration, Campaign Execution, and Log separated setup, monitoring, and audit.
- Integration surface
- 3 named channelsThe article names TikTok, Facebook, and YouTube among the integrated advertising platforms.
- Delivery path
- Dev → QA → productionGitHub Actions, Docker, and AWS ECR supported handoff across the client’s environments.
01 · Context
The spreadsheet was doing the work of a product.
Brand Networks helps advertisers manage and optimize media across social platforms. Its existing Cross Platform Optimization workflow lived in Google Sheets, where staff configured budget logic, monitored adjustments, and reviewed an expanding record of algorithm activity.
That format preserved the mechanics of the process but made the operation harder to navigate and maintain. Optimization insight arrived as text-heavy updates, filtering was limited, and a single day could produce hundreds of log entries. The client needed a stable application without losing the controls its operators already relied on.
02 · The decision
Preserve the operating model, not the spreadsheet interface.
Configure what should happen. See what is happening. Audit what happened.
Interviews with users of the existing tool established the workflow’s real anchors: adjustable metrics and schedules, fast filtering across dense tables and charts, and navigation that stayed available across repeated tasks. Those findings changed the interface, including more intuitive filters and a persistent navigation bar.
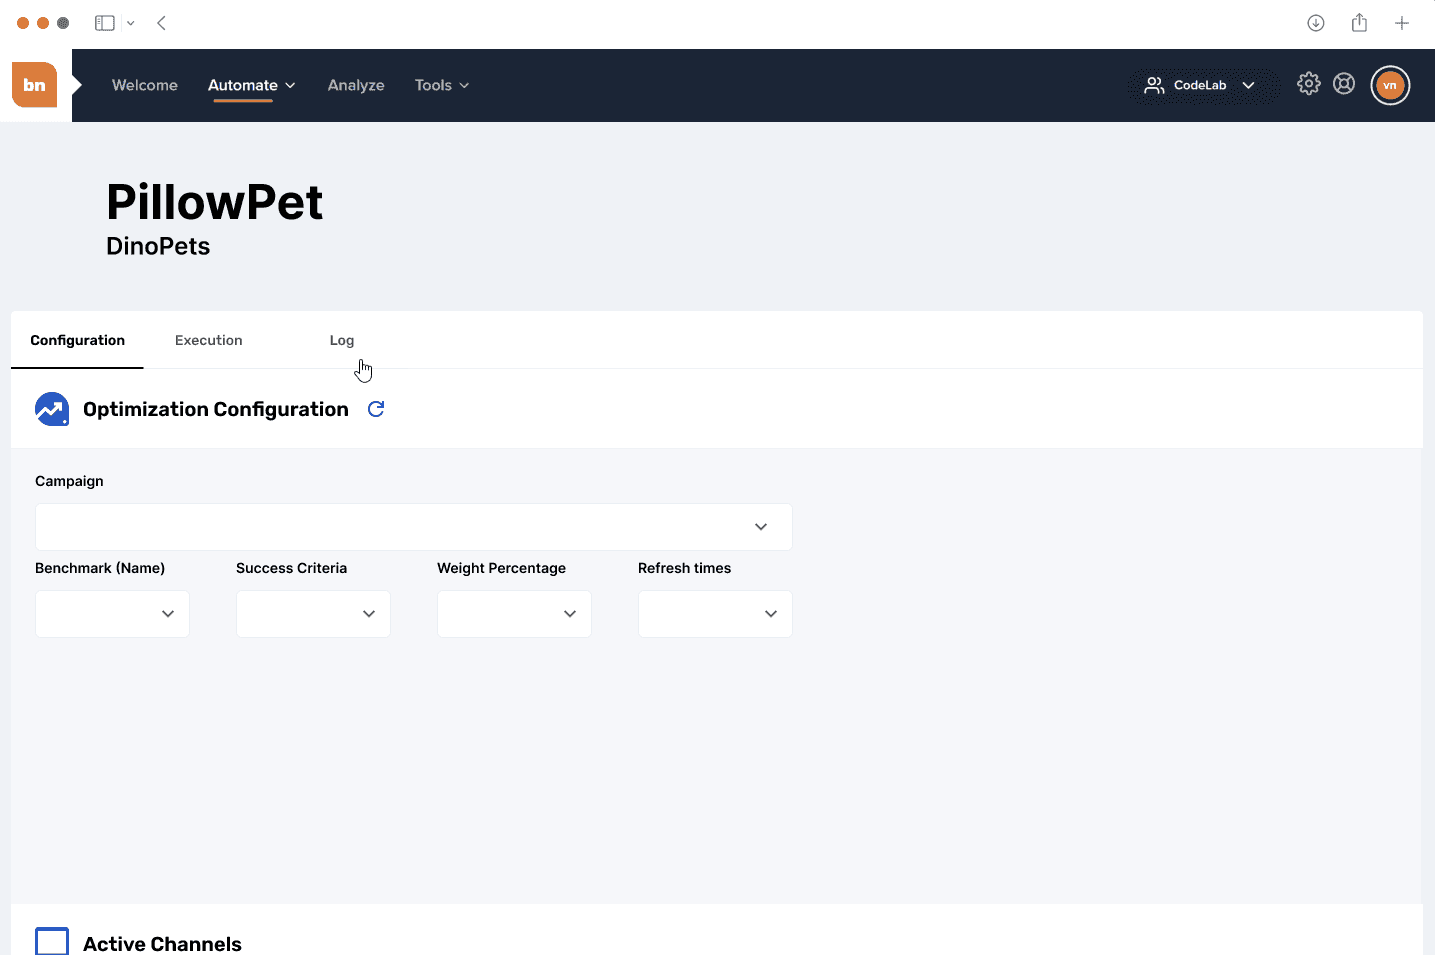
The product was organized into three pages. Configuration exposed campaigns, benchmarks, success criteria, weights, active channels, and refresh times. Campaign Execution visualized budget shifts and key metrics by platform. Log turned the algorithm’s actions into a filterable chronological record.
This structure made the migration more than a spreadsheet skin. Each page corresponded to a distinct operator decision while preserving a consistent information model across the workflow.
Product noteUser research changed the information architecture.
The team used interviews, collaborative feedback, competitive analysis, and scenario walkthroughs to refine how operators moved between configuration, execution, and logs.
- Table and chart filtering became a recurring interaction instead of a one-off control.
- Persistent navigation was added across all pages.
- Analytics layouts were standardized so the relevant metrics appeared consistently at a glance.
03 · What shipped
One application connected planning, performance, and accountability.
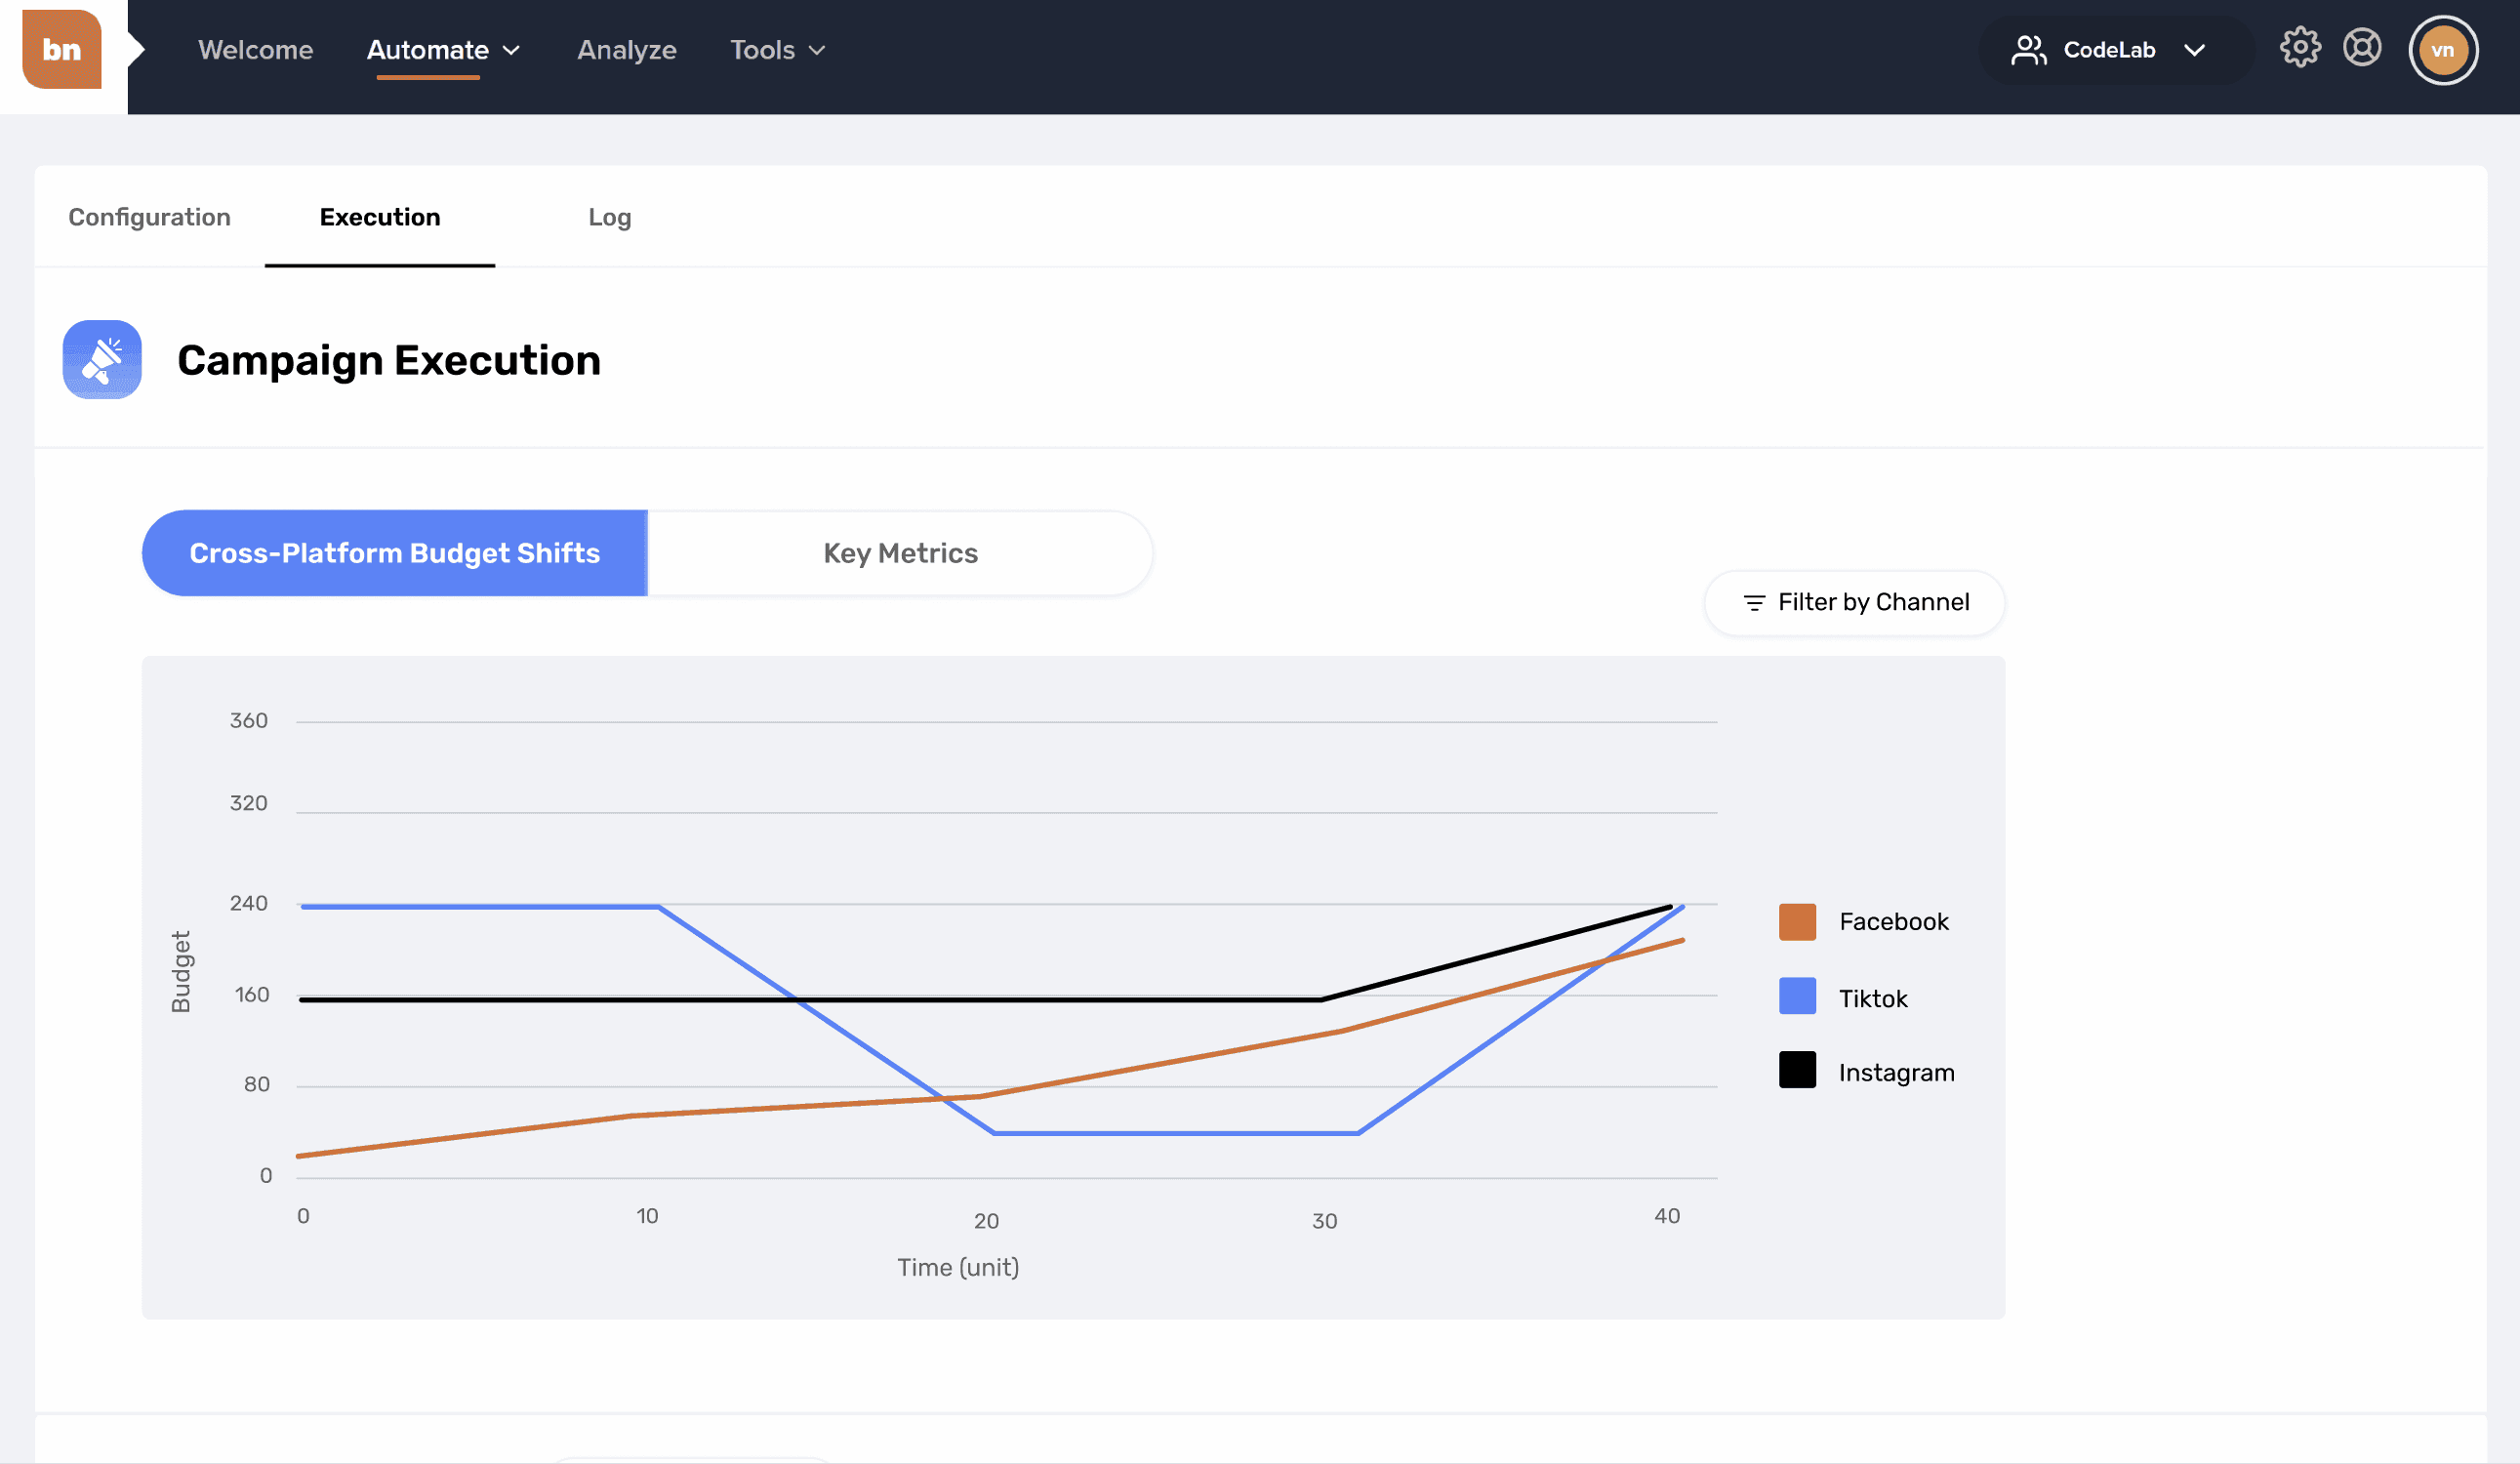
The Campaign Execution page replaced text-only optimization updates with charts and adaptive tables. Operators could switch between cross-platform budget shifts and individual metrics such as CPM and impressions, filter by channel, and inspect the raw records behind the visualization.
The logging workflow moved the growing spreadsheet record into PostgreSQL-backed retrieval with creation-time ordering and filtering. Configuration gave operators a clear place to adjust the algorithm’s metrics, benchmarks, and update cadence before execution.
The team also integrated the application with the client’s multi-platform API ecosystem, including TikTok, Facebook, and YouTube, and implemented OAuth flows for secure account access.
Monitor the optimization
Engineering noteThe handoff path was built into delivery.
The application was containerized and connected to the client’s deployment workflow so Brand Networks engineers could inspect progress in their own QA environment.
- GitHub Actions handled the CI/CD workflow and lint enforcement.
- Docker standardized builds across environments.
- AWS Elastic Container Registry stored images moving between development, QA, and production environments.
- Git Secrets checked the repository for exposed credentials.
04 · Evidence
The defensible result is a delivered operating workflow.
The published CodeLab article records an eight-week engagement, three completed product pages, successful integration with the named advertising platforms, a functional OAuth flow, and a CI/CD path through the client’s AWS registry.
The article does not publish usage, campaign-performance, reporting-time, or operator-satisfaction analytics. A legacy portfolio card claims a 63% reporting-time improvement, but its benchmark and measurement method are not available in the supplied project sources, so that number is not presented as case-study evidence.
The original portfolio detail page also contains unrelated template claims about financial institutions, transaction volume, and a product called FinTrack. Those statements conflict with the Brand Networks article and were excluded entirely.
05 · Reflection
Workflow migration succeeds when the hidden decisions become visible.
The important product work was not reproducing cells and formulas in a browser. It was identifying the decisions embedded in the spreadsheet—what to optimize, how to monitor it, and how to verify the result—and giving each one a durable interface.
The engagement also exposed integration risk early. Multiple advertising APIs, OAuth token exchanges, and client deployment requirements were not secondary engineering tasks; they determined whether the product could participate in the real operating environment.
A future iteration should measure the transition directly: time to configure a campaign, time to locate a specific optimization event, error rates during setup, and the reporting-time baseline behind the legacy 63% claim.